


Our Operations
Return to the Annual Report
Our Finances
In 2022, CGIAR Center Boards and leadership developed the Integration Framework Agreement (IFA) to confirm and clarify the path to One CGIAR, a reformulation of the way we work for greater integration and impact. Twelve Centers signed the agreement, while three remained CGIAR Centers but operated outside the IFA. The agreement was approved by all CGIAR Centers and their Board Chairs in early 2023.
In 2022, CGIAR revenue and expenses reflects the aggregated revenue of the 12 Centers who signed the IFA and the comparative 2021 information. Within the CGIAR System (CGIAR Centers, System Organization and System Council advisory bodies), revenue in 2022 was $771 million, a 10% increase from the previous year ($702 million in 2021). System-level results improved from a surplus of $1.7 million in 2021 to a net surplus of $2.5 million in 2022.
Explore below the highlights of our financial performance and funding in 2022 or search our dashboards to more closely examine our books.
Financial highlights
Funding channels
Investments in CGIAR may be delivered through the multi-funder CGIAR Trust Fund and/or directly to specific projects at CGIAR Research Centers (outside the Fund), which is called Bilateral Funding. Funding for the CGIAR Trust Fund is channeled through two funding Windows (W1, W3) with increasing levels of funder support. A third Window (W2) was discontinued in 2022 as part of One CGIAR reforms.
Window 3 (W3) – Project investments: funding allocated by Funders individually to projects that are defined by the Funders (with partners) and aligned with System-wide investments.
Window 2 (W2) – The Window 2 funding window of the Trust Fund has been discontinued as part of the One CGIAR reforms. Previous program-specific funding to Window 2 is now contributed to Window 1.
Window 1 (W1) – Under the One CGIAR reforms, Window 1 now receives all pooled funding. Within Window 1, Funders may a) contribute investments, with funding allocated to the entire CGIAR Portfolio of approved System-wide investments prioritized and allocated by Funders collectively through the System Council, supporting CGIAR as a whole; b) designate part of their Window 1 funding toward specific CGIAR Initiatives or Impact Area Platforms.
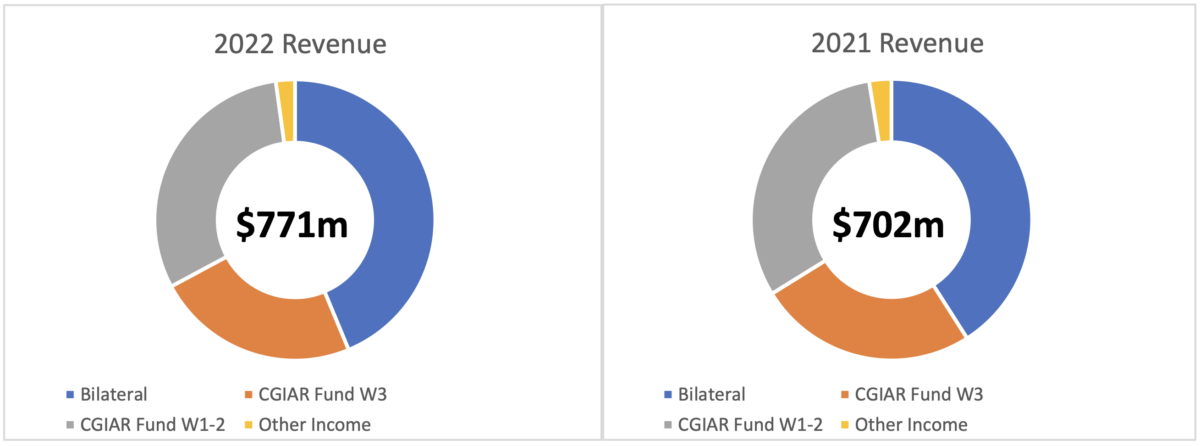
In 2022, CGIAR recognized revenue of $771 million, of which W1 accounted for 31% (same level as in 2021), W3 for 23% (a decrease of 2% compared to 2021), Bilaterals for 44% (an increase of 3% compared to 2021), and Other Income for 2% (a decrease of 1% from 2021).
See a comparison of 2022 and 2021 funding in Figure 1 below.
Further analysis of System revenue since 2011 by funding source is shown in Figure 2 below. W1 in 2022 remained at the same level as in 2021.
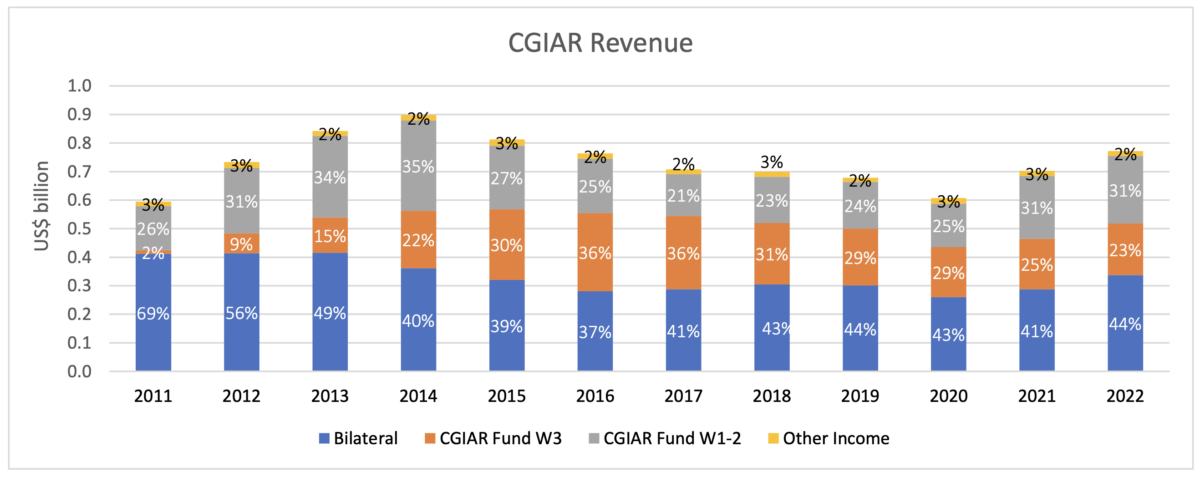
Figure 3 shows the main categories of expenditure. Overall, expenses in 2022 increased by 10% to $769 million from $701 million in 2021. In 2022, 83% of expenditure was on research and collaboration costs, and 17% was on general, administrative, and System-level costs.
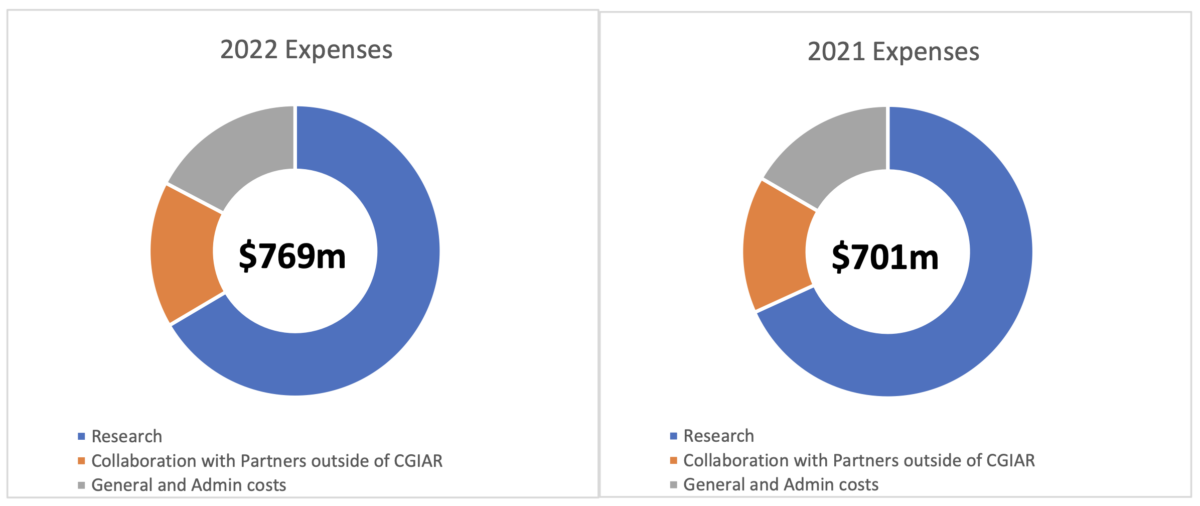
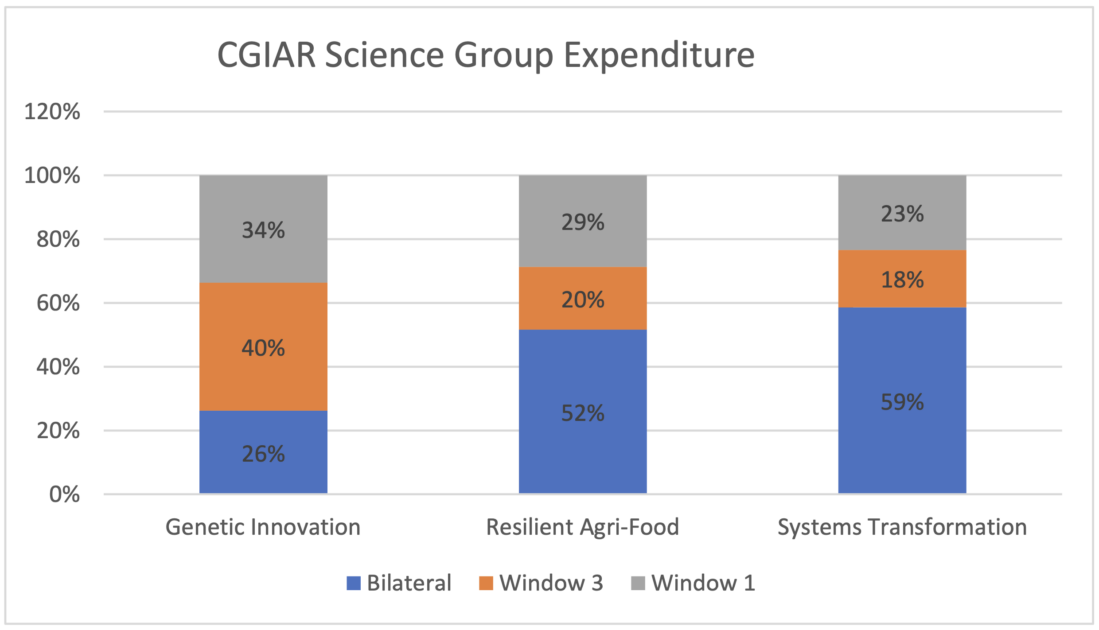
Figure 4 shows expenditure by CGIAR Science Groups/Action Areas by funding channel.
Genetic Innovation had the highest W1 spending at 34% followed by Resilient Agrifood Systems with 29% and Systems Transformation with 23%.
In 2022, CGIAR dedicated Window 1 program funding entirely for Portfolio Initiatives and Impact Area Platforms.
For access to more detailed information on funding and expenditure by Center, Program, or Funder, visit the CGIAR Financial Report dashboards.